What are Apple Unified Logs and why are they important in my digital forensics examinations?
Introduction
Unified logs keep pattern of life information with a high level of granularity in all Apple devices. Per Apple's documentation:
The unified logging system provides a comprehensive and performant API
to capture telemetry across all levels of the system. This system
centralizes the storage of log data in memory and on disk, rather than
writing that data to a text-based log file. You view log messages using
the Console app, log command-line tool, or Xcode debug console.
For example these logs, in iOS, keep information on:
- Device orientation (face up, face down.)
- Screen locks and unlocks with biometrics.
- Navigation start with destination address.
- Power on, power off device.
- Horizontal scrolling.
- App opening.
- Apps in focus.
There are many more artifacts of immense forensic value in these logs. Lionel Notari has been aggregating these artifacts at his ios-unifiedlogs.com webpage. His page is currently the best source for research based unified logs artifact aggregation.
In order to access these artifacts the logs need to be extracted and preserved. The end product of the extraction process will be a .logarchive archive.
 |
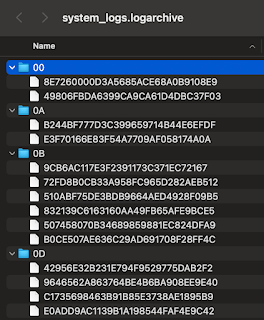
| Exemplar .logarchive |
In macOS systems the graphical user interface presents the .logarchive as a single entity. In reality it is a directory that aggregate a number of directories and files.
 |
| Contents of a .logarchive |
These directories and files are aggregated from the /private/var/db/diagnostics and /private/var/db/uuidtext directories in an iOS device. It is of note that the uuidtext directory contains support files while the diagnostic directory contains .tracev3 files.
 |
| Exemplar .tracev3 files |
There are different extraction methods we can use.
Extraction
In order to extract the logs we can do one of the following:
- Connect an iOS device to a macOS computer and use the log collect command at the terminal.
- Open a terminal and execute "sudo log collect --device --output /path/to/filename.logarchive"
- A useful flowchart for this process has been provide by Tim Korver and can be found at github.com/Ankan-42/Apple-Unified-Log
- Use third-party tools like UFADE or the iOS Logs Acquisition Tool.
- UFADE (Universal Forensics Apple Device Extractor) by Christian Peter can be downloaded at github.com/prosch88/UFADE
- iOS Logs Acquisition Tool by Lionel Notari can be downloaded at www.ios-unifiedlogs.com/iosunifiedlogtool
- Extracting the log files from a full file system extraction.
There are a few steps to follow in order to generate a .logarchive from files directly pulled from an iOS full file system extraction. This information in this section was kindly provided by Resarcher Johann Polewczyk of the Université de Lausanne.
- Extract contents (all subdirectories and files) of diagnostics and uuidtext folders and place them in the root of a directory.
- Create an Info.plist file and put it in the root of the directory.
Exemplar plist:<?xml version="1.0" encoding="UTF-8"?>
<!DOCTYPE plist PUBLIC "-//Apple//DTD PLIST 1.0//EN"
"http://www.apple.com/DTDs/PropertyList-1.0.dtd">
<plist version="1.0">
<dict>
<key>OSArchiveVersion</key>
<integer>4</integer>
</dict>
</plist>
- Must include Info.plist with OSArchiveVersion for compatibility.
The integer under the OSArchiveVersion must align with the iOS or OS version from source. - Add .logarchive to the end of the directoy name.
On macOS, with the .logarchive extension, the target folder is seen as a bundle you can open with the Console App or parse from the Terminal with the log show command. I have yet found a way to effectively produce reports from the Console app and working with the log show command is not as productive as I would need it to be. In order to query the data more effectively the data had to be converted into another format. It is also important to note that most examiners work in Windows based environments and having to use macOS devices for the querying and reporting might not be practical. In response we developed a way to query the logs outside macOS using iLEAPP.
Querying Apple Unified Logs
In this process the macOS device will be used only to convert the .logarchive to a JSON file. This would mean the examiner can use a single macOS device to do the conversions while querying and reporting on Windows based systems. Even though there are third-party scripts that provide a .logarchive to JSON conversion, we have decided that conversion via a macOS device itself is the more suitable and traceable way to make a conversion. Unlike third-party conversion tooling the macOS based process keeps the Apple key names intact and since it is an Apple device using Apple conversion processes the level of conversion reliability is enhanced. There is no better viewer, output, or conversion of data than to use the tool designed by the authors of the data itself.
In order to convert the .logarchive to a JSON format open the terminal and type the following:
log show --style json name_of_the_archive.logarchive > logarchive.json
Note that the name of the JSON file has to be logarchive.json so iLEAPP can process it. The conversion from .logarchive to JSON will take time. Be aware that the JSON file will be extremely large in comparison to the source .logarchive. For example a 1.63 GB archive will result in a 29.19 GB JSON file.
 |
| Size comparison |
When iLEAPP processes the file it pulls selected fields from each JSON record and puts them in a SQLite database. This greatly helps querying the data using SQL commands via the use of a SQLite viewer like DB Browser for SQLite. Since the amount of data is massive (a second of log output can contain 30K entries) there is no way of reviewing all the data using HTML, EXCEL, or PDF reporting formats. SQLite provide a way of doing so effectively.
Download and open iLEAPP.
Select the directory where the logarchive.json file resides.
Select your output directory.
From Available Modules select the Logs [Logarchive] module only.
Press Process.
 |
| iLEAPP selections for logarchive processing |
When completed open the iLEAPP report. There will be no HTML artifact to review due to the size limitations of reports in such a format. In the next release of iLEAPP a notification will appear as a pop-up when processing is finished as well as in the generated main HTML report advising that artifacts that are larger than what it is possible to show with an HTML report. It will advise to look into the LAVA - Only artifacts tab to see what artifacts fall in that category and it will direct the user to look into the _lava_artifacts.db to query the artifact. In the near future we will be releasing a new report viewer called LAVA that will enable users to work with any kind of data output, regardless of size, from LEAPP processing. In the mean time DB Browser for SQLite can accessed the process data from the iLEAPP generated database.
The following screens demonstrate the just described notifications.
 |
| Pop-up advising of LAVA only artifacts. |
 | |
| iLEAPP processing completed. Note the 18 million records. |
 |
| Notification in yellow highlight for the presence of LAVA only artifacts |
 |
| Contents of the LAVA only artifacts tab |
Querying the SQLite databse
Before we start querying the logs take the following into account:
- iLEAPP will pull out selected fields from the JSON file. Currently these are 'Timestamp', 'Process ID', 'Subsystem', 'Category', 'Event Message', and 'Trace ID'. More fields will be added based on the researched value of the information these might contain.
- The full log contents resides both in the .logarchive and in the JSON file.
- In the near future we will be building individual artifacts for specific log entries of value.
To start querying the database open the iLEAPP report folder and locate the _lava_artifacts.db file. Open it with DB Browser for SQLite.
 |
| Contents of the iLEAPP report folder |
Select the log archive table to view the contents.
 | |
| Contents of the logarchive table |
Right click on the timestamp column and select the Edit Display Format option. From the selection box pick Unix Epoch to Date or Unix Epoch To Local Time depending on the facts of your case and device.
 |
| Timestamp formatting in DB Browser for SQLite |
With all the data in place the examiner can use SQL statements in the Execute SQL tab to query the data. Here are some suggestions on how to narrow your focus:
- Use timestamps to center on times of interest.
- Be aware that a second of log recordings can have 14K to 30K entries. Maybe even more.
- Use known event_message values to focus on artifacts of interest. Take advantage of the research done by Lionel Notari and others.
- Use SQL statements to see a collection of entries before and after an artifact of interest to get a clear picture of the device's activity to include user generated actions.
An example of a useful artifact from the log is generated by the Orientation Subsystem. Notice the change from LandscapeLeft to FaceDown.
 |
| Orientation change recorded in the unified logs |
Summary
Apple Unified Logs are an essential data source that can't be overlooked by examiners moving forward.
- This data source needs to be acquired and preserved.
- In order to simplify analysis the logs they can be converted to a JSON file using a macOS device.
- To query the contents of the logs the JSON file can be turned into a SQLite database by using iLEAPP.
- The SQLite database can be accessed with DB Browser for SQLite. In the near future the LEAPP developers will release LAVA, which will enable users to access the contents of the SQLite database.


